MNE Python Notes
EEG ANALYSIS WITH MNE
This post includes codes extracted or modified from referenced articles for educational purposes. If there are any copyright issues, please contact the author for removal.
Concepts
MEG, STI
gradiometers, magnetometers
Launch MNE
anaconda nav
powershell
conda activate mne
jupyter lab
Work with continuous data
Processing raws
REF:
import needed packages:
import matplotlib

import pathlib

import mne
set storage location:
sample_data_dir = mne.datasets.sample.data_path()

# Convert to a pathlib.Path for more convenience
sample_data_dir = pathlib.Path(sample_data_dir)
sample_data_dir
Then use .plot() to visualize them!
Working with events
REF: WORKLAB NOTEBOOK #1
Converting raw data into events, naming, and extracting them aims to enhance data comprehension and analysis
Extract events:
events = mne.find_events(raw)

event_id = {
'Auditory/Left': 1,
'Auditory/Right': 2,
'Visual/Left': 3,
'Visual/Right': 4,
'Smiley': 5,
'Button': 32
}

len(events[events[:, 2] == 32])
len(events[events[:, 2]==4])+len(events[events[:, 2]==3])
Mark channels as bad:raw.info['bads'}+=['EEG 051']
Or just manually perform it after visualizing them.
Crop & Filter
REF: WORKSHOP NOTEBOOK #1
Selecting specific portions of the raw data based on predefined criteria or parameters, such as time range, location, or data type, to extract relevant subsets for further analysis.
NOTE: It’s a diffrent process from “cleaning”.
Sample code:
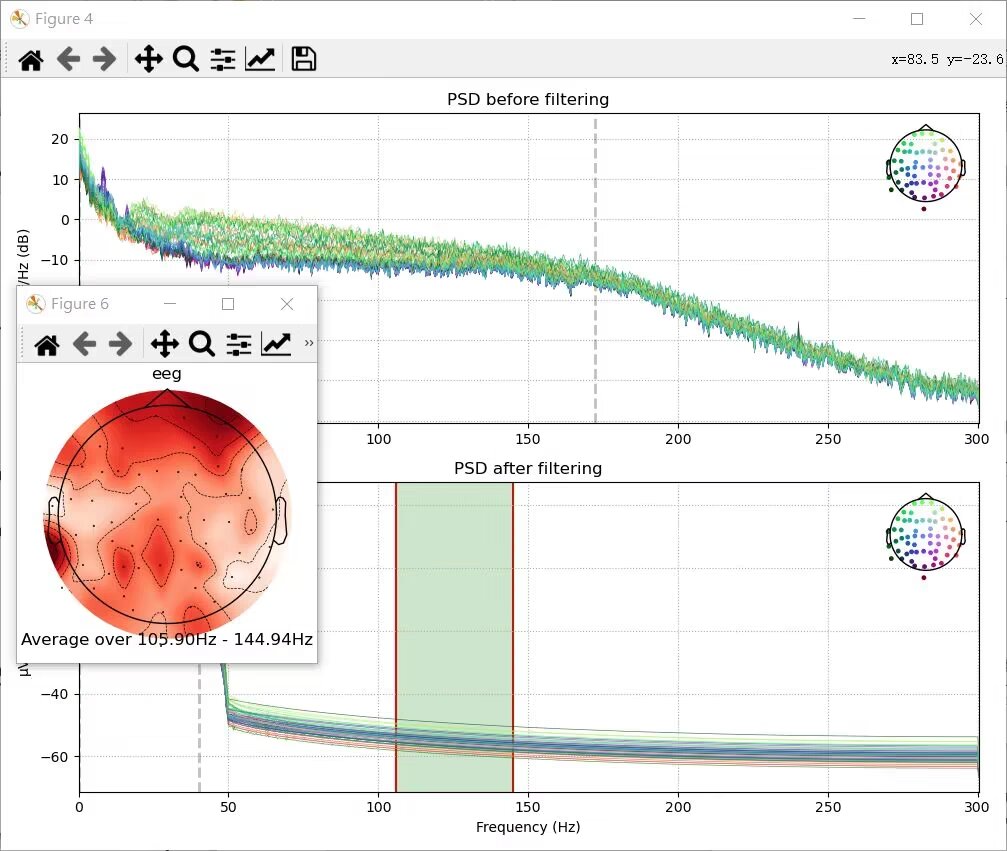
import matplotlib.pyplot as plt

fig, ax = plt.subplots(2)

raw_eeg_cropped.plot_psd(ax=ax[0], show=False)
raw_eeg_cropped_filtered.plot_psd(ax=ax[1], show=False)

ax[0].set_title('PSD before filtering')
ax[1].set_title('PSD after filtering')
ax[1].set_xlabel('Frequency (Hz)')
fig.set_tight_layout(True)
plt.show()
Output: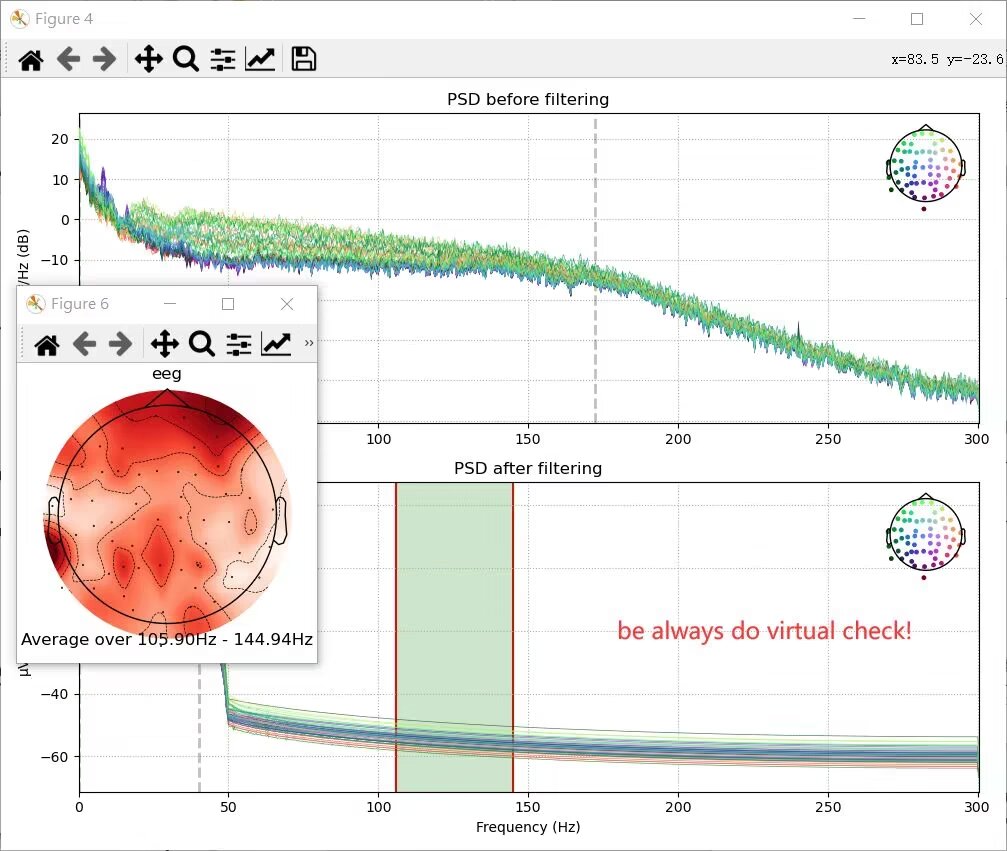
BIDS(Brain image data structure)
Write raw data to BIDS:
raw.info['line_freq'] = 60
subject_info = {
'birthday':(1996,10,1),
'sex':2,
'hand':3
}

raw.info['subject_info'] = subject_info
raw.info
Reading BIDS data:
bids_root = pathlib.Path('out_data/sample_BIDS')

bids_path = mne_bids.BIDSPath(subject='01',
                          session='01',
                          task='audiovisual',
                          run='01',
                          datatype='meg',
                          root=bids_root)

raw = mne_bids.read_raw_bids(bids_path)
EPOCH & EVOKED - Uncontinuous data
REF: NOTEBOOK #3
脑机接口社区 (Chinese)
EPOCH: Signals contracted from continuous EEG signals, divided by time spans. In MNE, EPOCH acts as a method marking continuous assets as time span assets.
To build EPOCH:
    # Firstly preprocess the raws
    # Divided into events and then
tmin = -0.3
tmax = 0.5
baseline = (None, 0)

epochs = mne.Epochs(raw,
                    events=events,
                    event_id=event_id,
            tmin=tmin,
                    tmax=tmax,
                    baseline=baseline,
                    preload=True)
epochs
Output:
Not setting metadata
320 matching events found
Setting baseline interval to [-0.2996928197375818, 0.0] s
Applying baseline correction (mode: mean)
Created an SSP operator (subspace dimension = 3)
3 projection items activated
Using data from preloaded Raw for 320 events and 481 original time points ...
0 bad epochs dropped
Number of events 320
Events Auditory/Left: 72
Auditory/Right: 73
Button: 16
Smiley: 15
Visual/Left: 73
Visual/Right: 71
Time range -0.300 – 0.499 s
Baseline -0.300 – 0.000 s
Also we can select epochs based on experimental criterias
epochs['Right'].copy().pick_types(meg=False,eeg=True).plot_image()Remember to first build events
EVOKED: “Evoked Potential (EP)” refers to specific patterns of electrical potentials recorded from the nervous system, particularly specific areas of the brain, in humans or other animals, following stimuli such as flashes or pure tones. The potentials are usually low, thus it’s common practice to average them.
Creating EVOKED from EPOCHS:
evoked_auditory = epochs['Auditory'].average()
evoked_visual = epochs['Visual'].average()
Reading EVOKED data:
evokeds = mne.read_evokeds(fname=pathlib.Path('out_data') / 'evokeds_ave.fif')
evokeds
Draw Global Field Power(GFP)
Draw EVOKED
Epoched data cleaning
Same thing, preprocess raws first
Then reject artifacts
reject_criteria = dict(mag=3000e-15,     # 3000 fT
                       grad=3000e-13,    # 3000 fT/cm
                       eeg=150e-6,       # 150 µV
                       eog=200e-6)       # 200 µV

flat_criteria = dict(mag=1e-15,          # 1 fT
                     grad=1e-13,         # 1 fT/cm
                     eeg=1e-6)           # 1 µV

epochs.drop_bad(reject=reject_criteria, flat=flat_criteria)
SSP & ICA
REF: NOTEBOOK #4
Official tutorial
The following is basically…summery of the above processes
We load the raws into BIDS, crop & filter and set events
finally we create projectors
bids_root = pathlib.Path('out_data/sample_BIDS')

bids_path = mne_bids.BIDSPath(subject='01',
                              session='01',
                              task='audiovisual',
                              run='01',
                              datatype='meg',
                              root=bids_root)
# MNE needs continuous data to work with,
# so to create projecters we need to start with
# raw data again
raw = mne_bids.read_raw_bids(bids_path)
raw.load_data()
raw.filter(l_freq=0.1, h_freq=40)

ecg_projs, ecg_events = mne.preprocessing.compute_proj_ecg(raw, n_grad=1, n_mag=1, n_eeg=0,
                                                           average=True)

eog_projs, eog_events = mne.preprocessing.compute_proj_eog(raw, n_grad=1, n_mag=1,n_eeg=1, average=True)
And for ICA, we ceate EPOCHS and fit
epochs_ica.info

n_components = 0.8  # Should normally be higher, like 0.999!!
method = 'picard'
max_iter = 100  # Should normally be higher, like 500 or even 1000!!
fit_params = dict(fastica_it=5)
random_state = 42

ica = mne.preprocessing.ICA(n_components=n_components,

                            method=method,
                            max_iter=max_iter,
                            fit_params=fit_params,
                            random_state=random_state)
ica.fit(epochs_ica)
OUTPUT:
Method picard
Fit parameters fastica_it=5
max_iter=100
Fit 82 iterations on epochs (201920 samples)
ICA components 28
Available PCA components 364
Channel types mag, grad, eeg
ICA components marked for exclusion (Output was in table format but im too lazy)
Then we can detect patterns and… plot scores or some
Try overlay to see the cleaning process really works:
epochs_cleaned=ica.apply(epochs.copy())
epochs_cleaned.plot()
epochs.plot()